Friday, June 25, 2010
A Time for Reflection
Over the course of this class and the four trips that were taken to New York City I have looked into how design and economy coincide. I started my blog looking at the Financial District and how that stems off into the rest of New York City. I have found while doing research and our trips I got my research topic into a new direction. I stayed true to figuring out economics of New York City but was inspired by places that we visited to look into how the economy helps drive those places to be successful or not. Through this research I have gained a lot of knowledge on what makes a space successful in bringing people there to interact with the space. I have realized the basic needs of a city and its population that will help me in making design decisions in the future to make successful space. As we are in a economic recession that I hope we are moving out of soon I feel the need to energize a space and give businesses the customer support it needs is essential and design can greatly affect a business. These spaces not only affect local economy but stem off too effect global economy. My research I feel was successful in finding what makes a place successful in a design sense and would like to thank my fellow classmates and my professors for helping understand the layout and design of New York City and I hope to go back soon to find other spaces to research and blog about.


Wednesday, June 23, 2010
Central Park by the Numbers

Central Park is one of the biggest parks in the country and with that brings many people from all over the world to this New York City landmark. Here are some facts of Central Park that I found interesting.
How big is Central Park?
843 acres or 6% of Manhattan's total acreage, including:
- 150 acres in 7 waterbodies
- 250 acres of lawns
- 136 acres of woodlands
58 miles
How many trees grow in Central Park?
26,000, including 1,700 American Elms
How many benches could I sit on in Central Park?
Over 9,000, which would stretch 7 miles if placed end to end.
How many bridges and arches are in Central Park?
36
How many playgrounds could I play in?
21
One fact that I payed attention to is that 35 million people visit Central Park each year, so that equates to about 96,000 people daily. By these numbers I figured that on average a person probably spends about 4-6 dollars each visit to central park and that might be on the low side. So with 35 million people visiting each year the revenue that Central Park creates for the City of New York is an astounding 140,000,000-210,000,000 dollars. Just think how much those concession stands make a year!
Lets Go to the Ballet!!
 These steps is a prime example of the nature of people around the area of the Lincoln Center making it a "look at me" kind of place.

Lincoln Center main building that rests at the top of the plaza that helps draw in visitors. The large arcs and all glass facade adds to the inviting presence of the Lincoln Center.
A recent fountain that was installed in the center of the Lincoln Center. The fountain's water display draws
visitors in to enjoy the fountain and maybe sit and have lunch on its outer rim. Hopefully they will get wet!!
Lincoln Center
Arriving at the Lincoln Center in New York City was a great sight to see. The surrounding modern architecture buildings housing opera, dance, and music with a huge fountain in the center that caught the eye of every passer by seemed like a very nice place to spend your afternoons if you have retired or won the lottery. Lincoln Center was developed in the 1950's to 1960's which forced out about 7,000 families. The development that was under control by John D. Rockefeller was New York City's great developments to bring a arts and entertainment central to New York. Lincoln Center is also located right by the world renowned Julliard School. The Lincoln Center brings many people in from New York City itself and the surrounding areas to help feed the economy of New York.
The Design of the Lincoln center comes into question with the very large plaza that could go well in a more populated and active area. Also, with this large plaza it could become a space that could be more energized with shopping and restaurants that could take up some of the lower retail around the area. I feel that the overall design of the buildings a well done with large modern columns and a large built in overhang to give pedestrians a place to go if it rains. All in all the Lincoln Center does a great job in bringing the best talent to New York City and help New York City stay on top financially.
The Design of the Lincoln center comes into question with the very large plaza that could go well in a more populated and active area. Also, with this large plaza it could become a space that could be more energized with shopping and restaurants that could take up some of the lower retail around the area. I feel that the overall design of the buildings a well done with large modern columns and a large built in overhang to give pedestrians a place to go if it rains. All in all the Lincoln Center does a great job in bringing the best talent to New York City and help New York City stay on top financially.
Friday, June 18, 2010
Mix Use Energy
 Here is a space off of W 34th Street that has the same qualities of Rockefeller Center. Notice the tables and chairs to accommodate different group sizes and the space that it generates with the walking path along side of it. Also of course the mix use buildings right next to it.
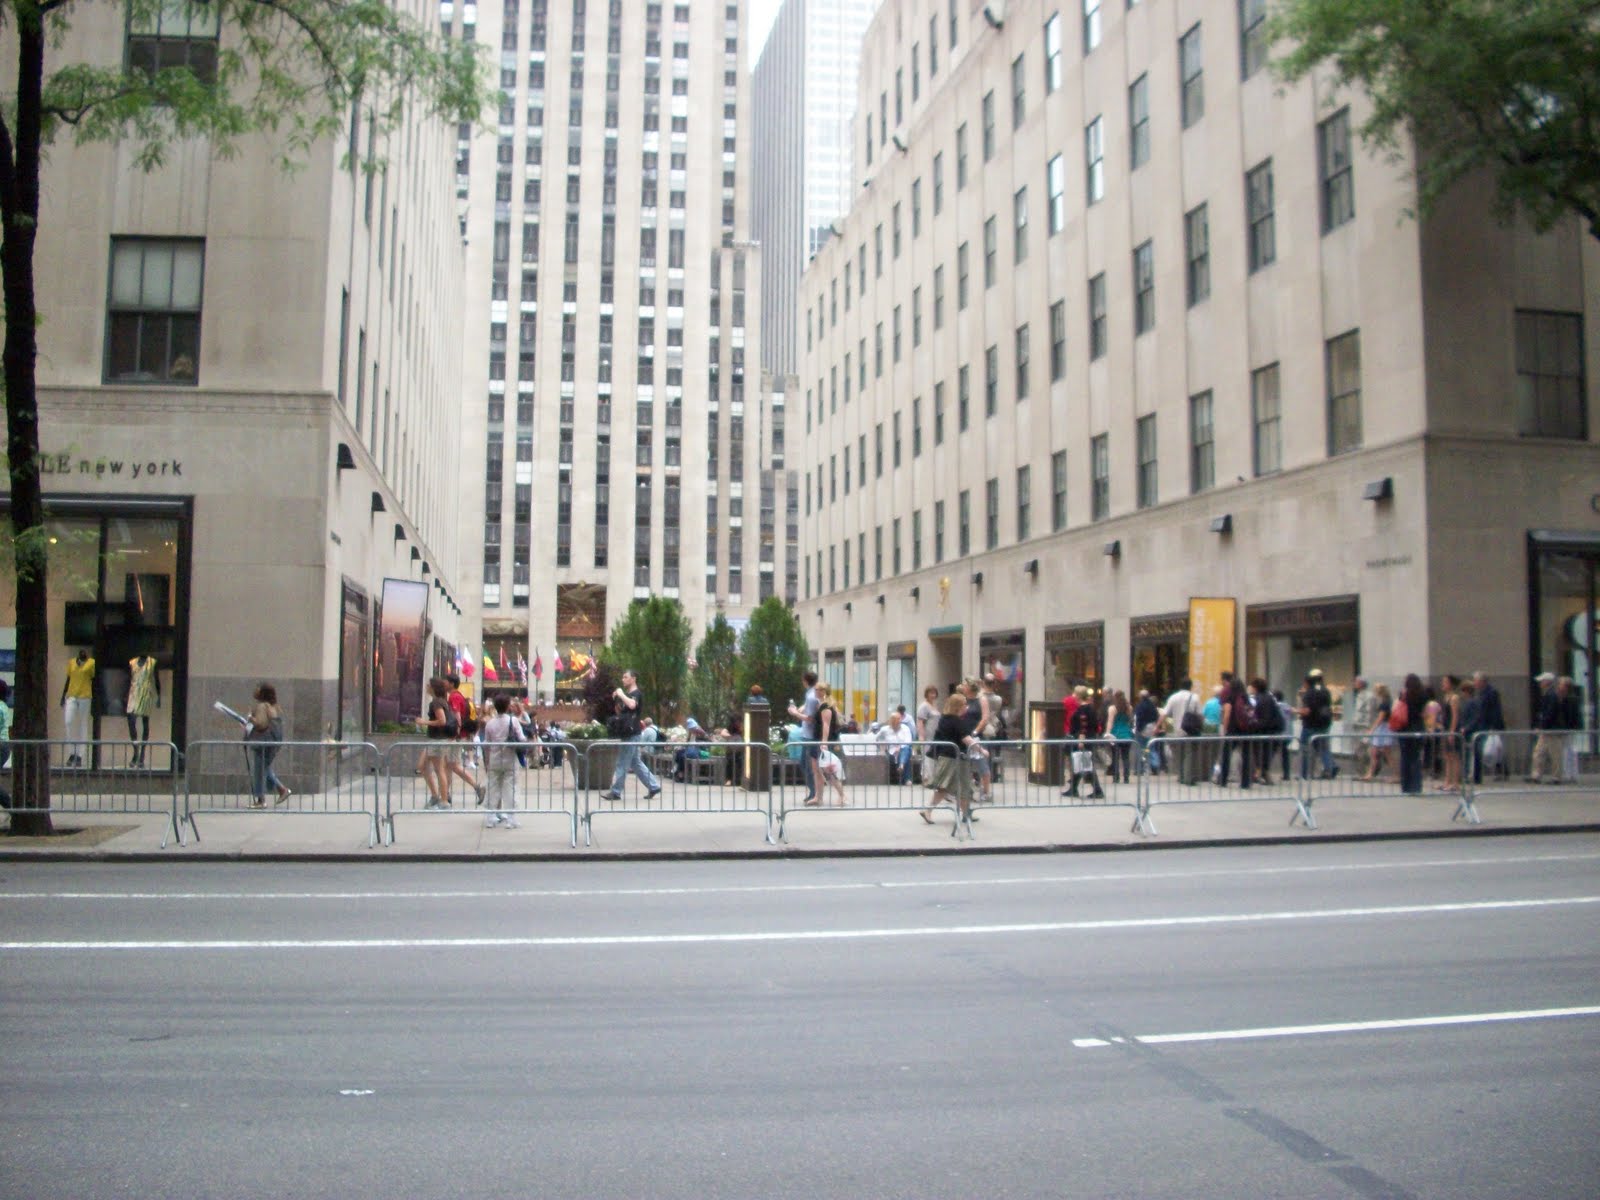
Here are some of the mix use spaces that show great space that people actually use.
Here is Rockefeller Center what makes this space unique is that it is a public space that feels private, but many people energize this space due to the shops on either side, places to get food, and tables and chairs. How easy is that!
Energize Your Space
I have noticed what makes a successful place to sit and hang out in New York City. If your interested in how to energize a space for people to eat, hang out, and buy stuff you need tables and chairs that can accommodate people that come in all groups from one to eight. Also people need to watch other people. Its a weird thing that people like to do when you are sitting there eating or talking. You also need shopping and eating in an almost 360 degree area. I know that these seems kind of a duh answer but I feel that many architects/designers feel the need that green space and secluded areas make the best places for people to go and eat their lunch. I have found walking around New York City that spaces that didn't have these simple design solutions often lacked people to sit in those areas. They became more of a homeless people territory. A good example of a space that shows these qualities is Rockefeller Center, its spacial relationships to the mix use shopping and seating is great. As Professor Roy would say a space not incorporating some of these design principles probably will just look good on a computer render. So it all ties back into what drives the economy and these areas definitely do.
Tuesday, June 15, 2010
Store Designs (Pedestrian Vs. Vehicular)


Here is a store front having modern designs for
vehicular traffic (notice the taller store fronts
Here are store fronts that were made in the
and bigger signs) 1970's (smaller pedestrian level stores and
smaller signs)
This comparison shows how the automobile has influenced the economy through the design of the stores in Times Square.
Times Square


Times Square in New York City hasn't always been so glamorous at one point it was described by many newspapers as the "sinkhole" of New York. In the 1970's Times Square suffered from prostitution and crime. It was a place that tourists stayed far away from.
All of the businesses there would attract the wrong people and New York's economy could prosper from a better plan in Times Square. Times Square was designed with the pedestrian in mind too with the entrances to shops all having the similar NYC flavor too them. Today shops boast huge signs, each designed by their own company with the car in mind. In 1980 political officials began to work together with businesses to help drive the crime and bad businesses in the area out. By 1993 their were 36 adult businesses in the area compared to the 140 in the late 1970's. New York would begin to bring businesses that would make Times Square one of the most visited areas in all of New York City. Today everything from a giant M&M's store to a designer clothing store can be found in Times Square. New York also recently added a green pedestrian overflow into the street to help pedestrians move throughout Times Square safely. This transition brought positive economic change to New York City through new businesses, large retail, and ultimately many jobs for people.
Wednesday, June 9, 2010
A Look at Commuter Charts
Inbound Commuters by County
Thousands of Workers Commuting into Each County
| 1980 | 2000 | Percentage Change | |
|---|---|---|---|
| Manhattan, N.Y. | 1,395 | 1,459 | 4.6 |
| Brooklyn, N.Y. | 192 | 236 | 22.7 |
| Queens, N.Y. | 178 | 229 | 28.8 |
| Nassau, N.Y. | 150 | 195 | 30.2 |
| Bergen, N.J. | 132 | 188 | 43.0 |
| Essex, N.J. | 151 | 179 | 18.5 |
| Middlesex, N.J. | 96 | 168 | 75.4 |
| Morris, N.J. | 65 | 138 | 114.0 |
| Westchester, N.Y. | 88 | 134 | 51.7 |
| Union, N.J. | 111 | 116 | 4.0 |
| Hudson, N.J. | 80 | 113 | 40.8 |
| Bronx, N.Y. | 93 | 112 | 20.1 |
| Fairfield, Conn. | 61 | 109 | 77.3 |
| Somerset, N.J. | 43 | 96 | 125.4 |
| Passaic, N.J. | 65 | 77 | 19.3 |
| New Haven, Conn. | 41 | 72 | 77.7 |
| Suffolk, N.Y. | 44 | 71 | 62.3 |
| Monmouth, N.J. | 29 | 67 | 126.5 |
| Staten Island, N.Y. | 18 | 34 | 88.0 |
| Rockland, N.Y. | 15 | 29 | 88.0 |
| Orange, N.Y. | 14 | 28 | 103.8 |
| Dutchess, N.Y. | 15 | 25 | 64.4 |
| Hunterdon, N.J. | 9 | 24 | 160.3 |
| Litchfield, Conn. | 11 | 19 | 72.2 |
| Warren, N.J. | 10 | 16 | 69.0 |
| Sussex, N.J. | 4 | 10 | 143.9 |
| Putnam, N.Y. | 4 | 10 | 130.7 |
Commuting Patterns in New York City

As New York City started to change in the 1980's and suburban sprawl was the thing to do, New York City especially Manhattan was the center of the economy for many in and around New York City. When suburban neighborhoods started to take a strong hold for the population people started to think that cities would no longer be the center of the job market but it would be a 50/50 share or more between the two.
"With the emergence of the American suburb in the 1940s and its growing prominence in the 1950s and 1960s, the expectation arose that the suburbs would eventually become independent of their central, or "host," cities."- Source (Crane and Chatman [2003]).
Today we can now see that cities such as New York are still the centers for the job market and a lot of the American population still commute to these areas for the 9 to 5 work day. Even though over the past 30 years neighboring regions have shown a 100 percent increase in commuting such as Hunterdon, Sussex, Monmouth, Somerset, and Morris counties in New Jersey and to Putnam and Orange counties in New York.
If we take a look at the numbers the 100 percent gain falls far short of the population still commuting to the city. One of the biggest counties that had a growth was Nassau County which drew 195,000 commuters in 2000. Manhattan on the other hand drew 1.5 million workers. Also today more than ever people are being desensitized to the fact of 30 min-1 hour commutes to work.


How Immigrants Affected New York City Economy
New York City went into being almost bankrupt in the 1970's but immigrants helped boost the economy. In the 1970's foreign born population finally started to rise since its high in the 1930's Immigrant workers help build New York City and today they account for about 43 percent of New York City workers.
From the 1970's and into today foreign born population in New York City is on the rise while native born is on a slow decline. From 2000 to 2007 the immigrant population has boosted economy and jobs in the boroughs of Queens and Brooklyn. In ten neighborhoods that we sampled with the highest immigration also so the most boost in economy, showing that these areas had a rise in businesses of 14.8 percent while the rest of New York City only showed a rise of 3.3 percent.
Immigrants’ Share of Industry Workforce
Industry Share
Personal Services (e.g., nail salons, dry cleaning) 68%
Repair Services and Community Organizations 56%
Construction 56%
Leisure and Hospitality 55%
Manufacturing 53%
Health and Social Services 50%
Transportation 47%
Retail and Wholesale Trade 47%
All Industries 43%
Financial Activities 36%
Professional and Business Services 34%
Educational Services 27%
Government 27%
Information 21%
Utilities 19%
Immigration has had a huge impact on New York City and this list shows how the 43 percent of the population of immigration has been distributed over the workforce.
Tuesday, June 8, 2010


Brooklyn Navy Yard
The Brooklyn Navy Yard is a historical place in New York City that was first opened in 1801. The Naval Yard housed many seamen who worked on the U.S. Navy's many boats. In 1970 the Navy Yard was closed up and sold to the City of New York for 24,000,000 dollars. This sell was based on the current economy of the steel industry and demands from international steel production. The United States couldn't afford to refine the steel in the U.S. anymore based on the cost of labor. So as a result with many factories and places that relied on steel production they closed up.
Steel workers across the U.S. formed the Steelworkers Union to help U.S. steelworkers to fight back against costs of foreign production. Then in the 1974 they created the Experimental Negotiation Agreement (ENA). The ENA was to help negotiate agreement of new collaborative bargaining agreements. This attempt by the ENA failed and the decline of the U.S. steel industry continued.
Today, the Naval yard is used as a tourists attraction with a museum and walking tours. The thriving industrial park has 40 buildings, 230 tenants, and 5,000 employees. New York City still intends to create and retain industrial jobs. New York City is keeping this Yard environmentally friendly while also keeping and celebrating the Yards history.
Thursday, June 3, 2010
Special District Zoning (Manhattan)
BPC-BATTERY PARK CITY SPECIAL DISTRICT
The Special Battery Park City District (BPC) was created, in accordance with a master plan, to govern extensive residential and commercial development in an area close to the business core of Lower Manhattan. The central component of the master plan is an office complex, flanked by two large residential neighborhoods extending south to Battery Park and north to Chambers Street. A continuous esplanade providing public access to the Hudson River waterfront is a major element of the plan. The district regulates permitted uses and bulk within specified zones and establishes special design controls with respect to front building walls, and building heights and parking.
Source- http://www.nyc.gov/html/dcp/html/zone/zh_special_purp_mn.shtml
LM-LOWER MANHATTAN SPECIAL DISTRICT
The Special Lower Manhattan District (LM) was established to enhance the vitality of Lower Manhattan, home of the city's oldest central business district and a burgeoning residential community. The special district regulations allow for the conversion of older commercial buildings to residential use, and encourage a dynamic mix of uses in the area, while protecting its distinctive skyline and streetscape. The built character of the area is enhanced by height and setback regulations and limitations on the dimensions of tall buildings. The pedestrian environment is improved by requirements for retail continuity, pedestrian circulation space and subway station improvements.
The Special Lower Manhattan District includes the area south of Murray Street, Chambers Street and the Brooklyn Bridge, excluding Battery Park City. Two subareas are located within the special district: the South Street Seaport Subdistrict and the Historic and Commercial Core. The South Street Seaport Subdistrict protects the scale and character of 18th and 19th century mercantile buildings by allowing the transfer of development rights from certain lots to designated receiving lots. The Historic and Commercial Core seeks to ensure that new development in the area bounded by Wall Street, Broadway, Water Street and Whitehall Street will be compatible with existing buildings that line the Street plan of New Amsterdam and Colonial New York, a street layout accorded landmark status by the NYC Landmarks Preservation Commission.
Source- http://www.nyc.gov/html/dcp/html/zone/zh_special_purp_mn.shtml
Financial District Zoning

Here is a zoning map that I did showing Residential, Commercial, and Manufacturing districts around lower Manhattan. NOTE: Yellow=BATTERY PARK CITY SPECIAL DISTRICT, Blue=MANUFACTURING ZONING, Red= COMMERCIAL ZONING, Purple= RESIDENTIAL ZONING.
Subscribe to:
Comments (Atom)